# Broadway Dashboard
[Online documentation](https://hexdocs.pm/broadway_dashboard)
<!-- MDOC !-->
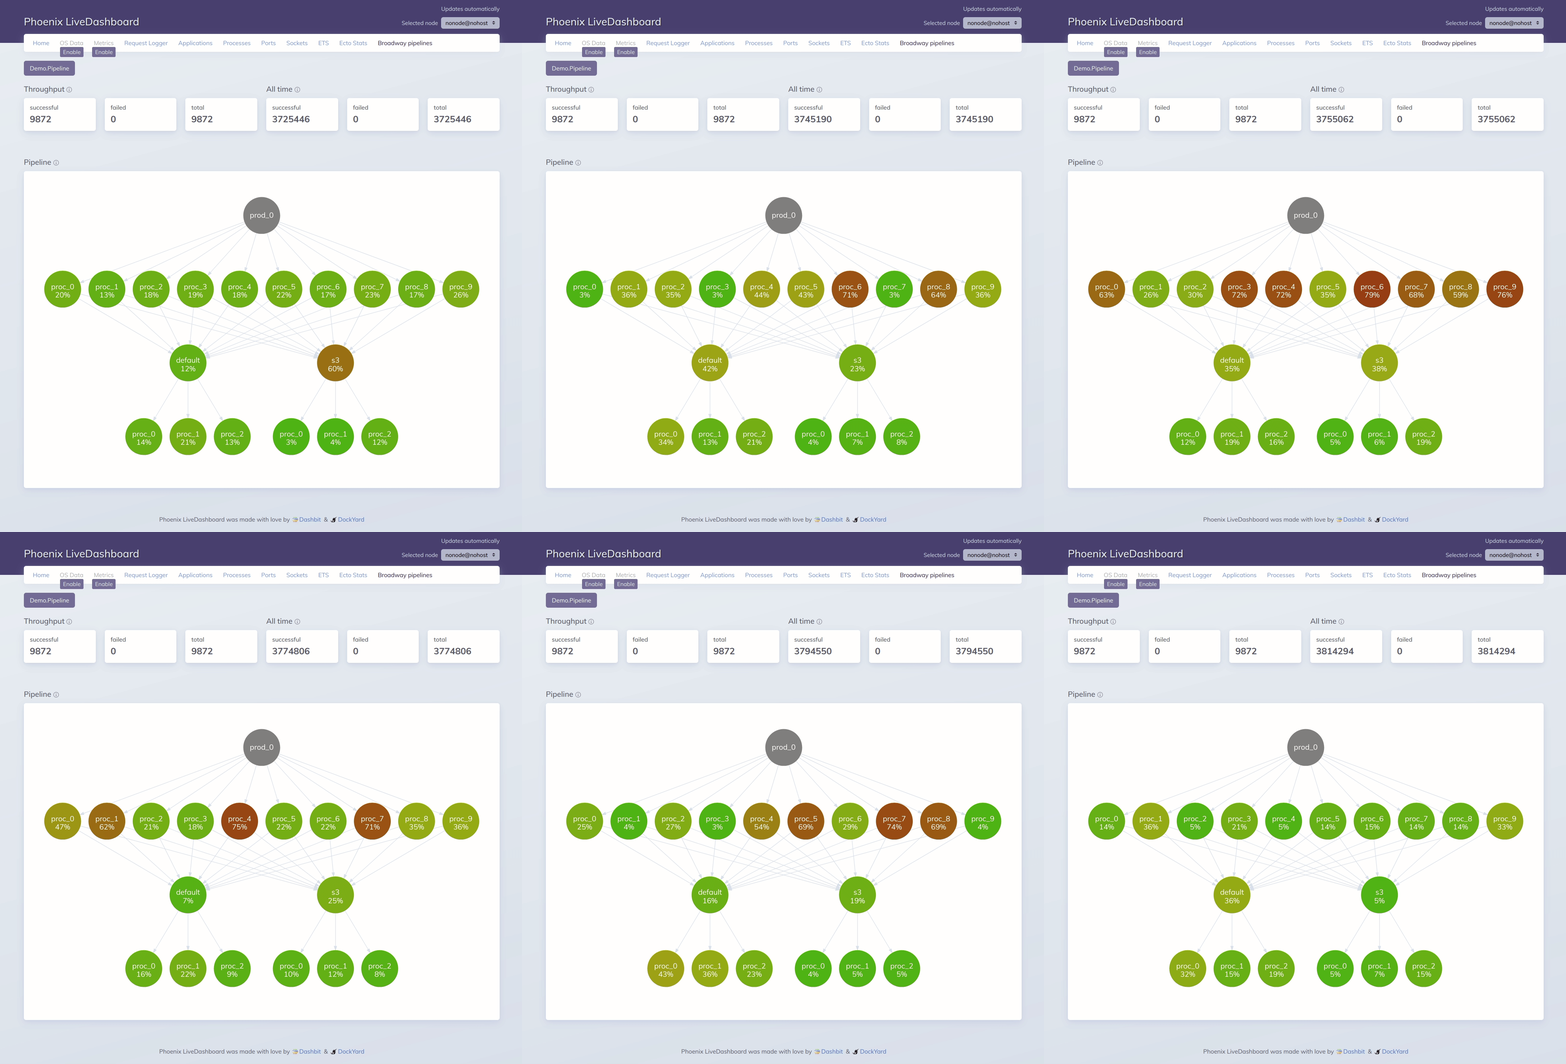
`BroadwayDashboard` is a tool to analyze [`Broadway`](https://hexdocs.pm/broadway)
pipelines. It provides some insights about performance and errors for
your running pipelines.
It works as an additional page for the [`Phoenix LiveDashboard`](https://hexdocs.pm/phoenix_live_dashboard).
You can inspect pipelines on remote nodes that are not running `BroadwayDashboard` too.
See [Distribution](#distribution) for details.

## Integration with Phoenix LiveDashboard
You can add this page to your Phoenix LiveDashboard by adding as a page in
the `live_dashboard` macro at your router file.
```elixir
live_dashboard "/dashboard",
additional_pages: [
broadway: {BroadwayDashboard, pipelines: [MyBroadway]}
]
```
The `:pipelines` option accept pipeline names (the `:name` option of your Broadway).
By omitting the `:pipelines` option, `BroadwayDashboard` will try to autodiscover your pipelines.
```elixir
live_dashboard "/dashboard",
additional_pages: [
broadway: BroadwayDashboard
]
```
Once configured, you will be able to access the `BroadwayDashboard` at `/dashboard/broadway`.
## Using from the command line with PLDS
It's possible to use Broadway Dashboard without having to install it on your application.
PLDS stands for Phoenix LiveDashboard Standalone and it's a CLI version of Phoenix LiveDashboard with
some tools pre-installed. One of those tools is Broadway Dashboard.
To install PLDS on your machine, you can run:
```
$ mix escript.install hex plds
```
Then connect to your running node with:
```
$ plds server --connect mynode --open
```
For more information about the usage, please check the [PLDS documentation](https://hexdocs.pm/plds).
## Distribution
**Phoenix LiveDashboard** works with distribution out of the box, and it's not different
with **Broadway Dashboard**! You can inspect your pipelines that are running on connected nodes.
You can also inspect pipelines from nodes that are not running the same system of
your dashboard. This is possible because we "copy" the essential parts of this
tool to the remote node when it's not running `BroadwayDashboard`. We stop the tracking
once the node that started it is disconnected.
<!-- MDOC !-->
## Installation
Add the following to your `mix.exs` and run mix `deps.get`:
```elixir
def deps do
[
{:broadway_dashboard, "~> 0.3.0"}
]
end
```
After that, proceed with instructions described in **Integration with Phoenix LiveDashboard** above.
## Acknowledgment
This project is based on [Marlus Saraiva's](https://github.com/msaraiva/) work from
[his presentation at ElixirConf 2019](https://www.youtube.com/watch?v=tPu-P97-cbE).
In that talk he presented a graph showing the work of a Broadway pipeline, which is
essentially the same we display in this project.
Thank you, Marlus! <3
## Development
After cloning this project, you can use the following command to run a development server with a
sample pipeline:
$ mix dev
This is going to start a server running Phoenix LiveDashboard.
Use `mix test` to run the test suite.
## License
Copyright 2021 Dashbit
Licensed under the Apache License, Version 2.0 (the "License");
you may not use this file except in compliance with the License.
You may obtain a copy of the License at
http://www.apache.org/licenses/LICENSE-2.0
Unless required by applicable law or agreed to in writing, software
distributed under the License is distributed on an "AS IS" BASIS,
WITHOUT WARRANTIES OR CONDITIONS OF ANY KIND, either express or implied.
See the License for the specific language governing permissions and
limitations under the License.
