# Sampling Profiler
The sampling profiler is a single process profiler to inspect runtime of time consuming processes. This is especially useful for doing performance analysis and optimization.
Please checkout the full documentation at: https://hexdocs.pm/profiler/Profiler.html
Example output for profiling the [Diode Blockchain Server](https://github.com/diodechain/diode_server_ex):
```
iex(2)> Profiler.profile(Chain.Worker)
100% {:proc_lib, :init_p_do_apply, 3, [file: 'proc_lib.erl', line: 249]}
100% {:gen_server, :handle_msg, 6, [file: 'gen_server.erl', line: 711]}
100% {:gen_server, :try_dispatch, 4, [file: 'gen_server.erl', line: 637]}
26% {Chain.Worker, :handle_info, 2, [file: 'lib/chain/worker.ex', line: 103]}
26% {Process, :sleep, 1, [file: 'lib/process.ex', line: 253]}
74% {Chain.Worker, :handle_info, 2, [file: 'lib/chain/worker.ex', line: 110]}
74% {Chain.Worker, :do_work, 1, [file: 'lib/chain/worker.ex', line: 122]}
24% {Chain.Block, :sign, 2, [file: 'lib/chain/block.ex', line: 269]}
24% {Chain.Header, :sign, 2, [file: 'lib/chain/header.ex', line: 59]}
24% {Chain.Header, :encode_egg, 1, [file: 'lib/chain/header.ex', line: 31]}
50% {Chain.Block, :sign, 2, [file: 'lib/chain/block.ex', line: 270]}
50% {Chain.Header, :update_hash, 1, [file: 'lib/chain/header.ex', line: 54]}
50% {Chain.Header, :encode_chicken, 1, [file: 'lib/chain/header.ex', line: 43]}
50% {MnesiaMerkleTree, :root_hash, 1, [file: 'lib/mnesiamerkletree.ex', line: 62]}
49% {MnesiaMerkleTree, :update_merkle_hash_count, 1, [file: 'lib/mnesiamerkletree.ex', line: 393]}
49% {:lists, :zipwith, 3, [file: 'lists.erl', line: 451]}
49% {:lists, :zipwith, 3, [file: 'lists.erl', line: 451]}
13% {MnesiaMerkleTree, :signature, 1, [file: 'lib/mnesiamerkletree.ex', line: 460]}
23% {MnesiaMerkleTree, :signature, 1, [file: 'lib/mnesiamerkletree.ex', line: 461]}
23% {BertExt, :encode!, 1, [file: 'lib/bert.ex', line: 43]}
12% {Enum, :"-map/2-lists^map/1-0-", 2, []}
9% {Enum, :map, 2, [file: 'lib/enum.ex', line: 1395]}
:ok
```
# fprof Sugar
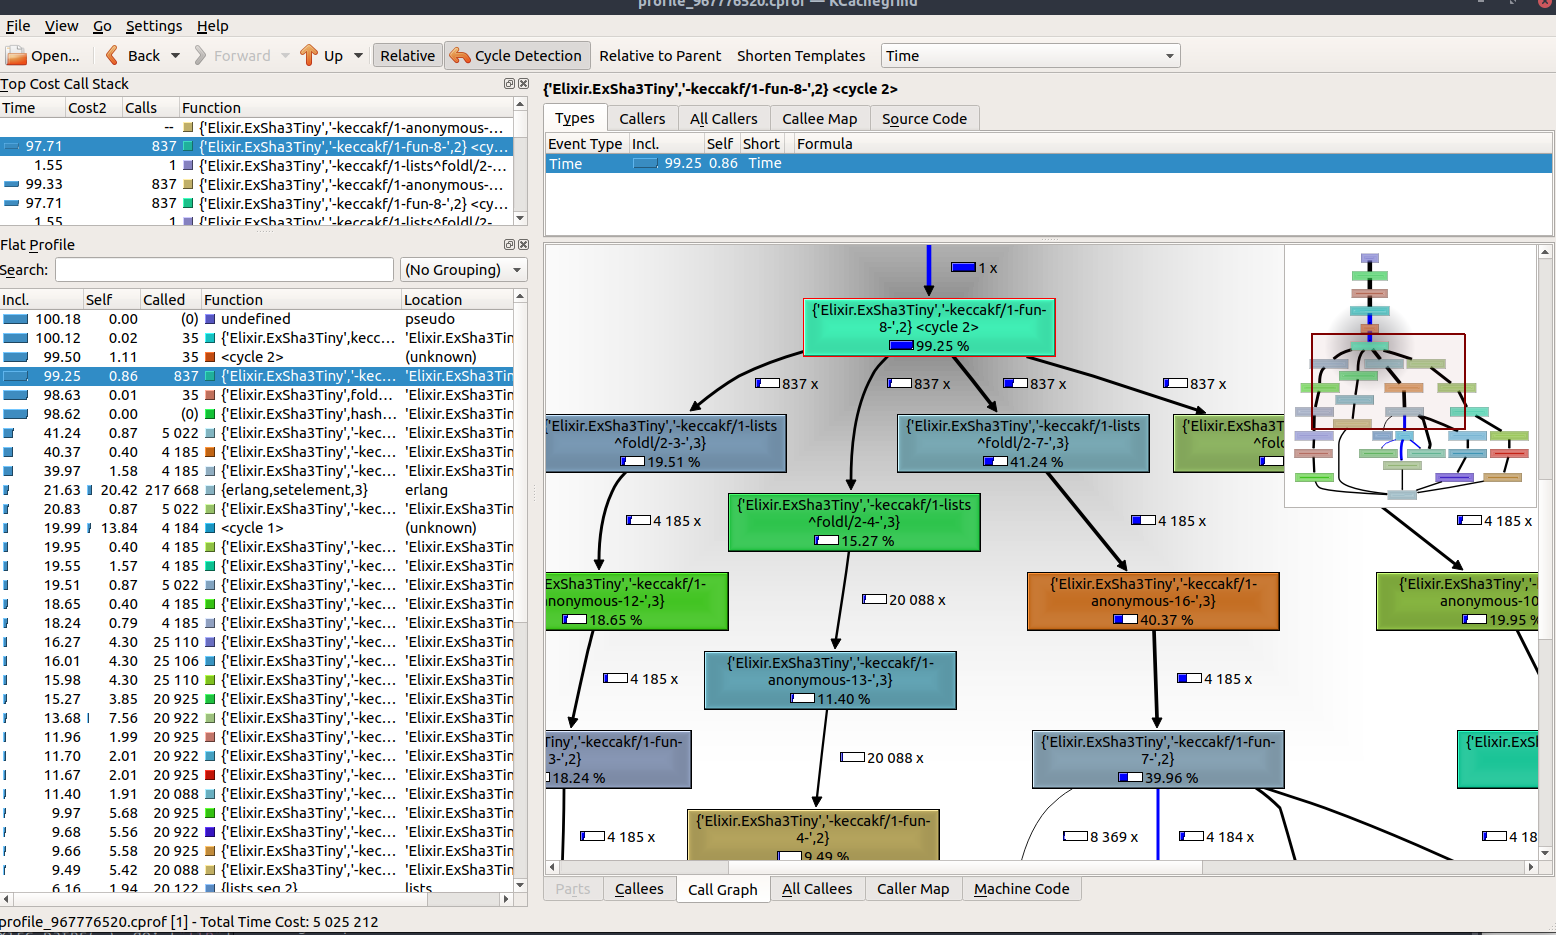
Also the profiler has tooling to profile using the erlang native `fprof` module and will call the external [kcachegrind](https://kcachegrind.github.io/html/Home.html) tool when available for visualization.
MacOS: `brew install qcachegrind`
Ubuntu: `sudo apt install kcachegrind`
Windows: https://sourceforge.net/projects/qcachegrindwin/files/latest/download
```
iex(6)> Profiler.fprof(fn -> ExSha3Tiny.sha3_256(str) end)
```
## Installation
The profiler can be installed by adding `profiler` to your list of dependencies in `mix.exs`:
```elixir
def deps do
[
{:profiler, "~> 0.2"}
]
end
```
