# Prometheus.erl [](https://hex.pm/packages/prometheus)
[Prometheus](https://prometheus.io) monitoring system and time series database client in Erlang.
### Metrics
#### Standard
- [x] Counter
- [x] Gauge
- [x] Summary
- [x] Histogram
#### Custom Collectors
- `erlang_vm_memory_collector` - Collects information about Erlang VM memory usage mainly using `erlang:memory/0`
- `erlang_vm_statistics_collector` - Collects Erlang VM statistics using `erlang:statistics/1`
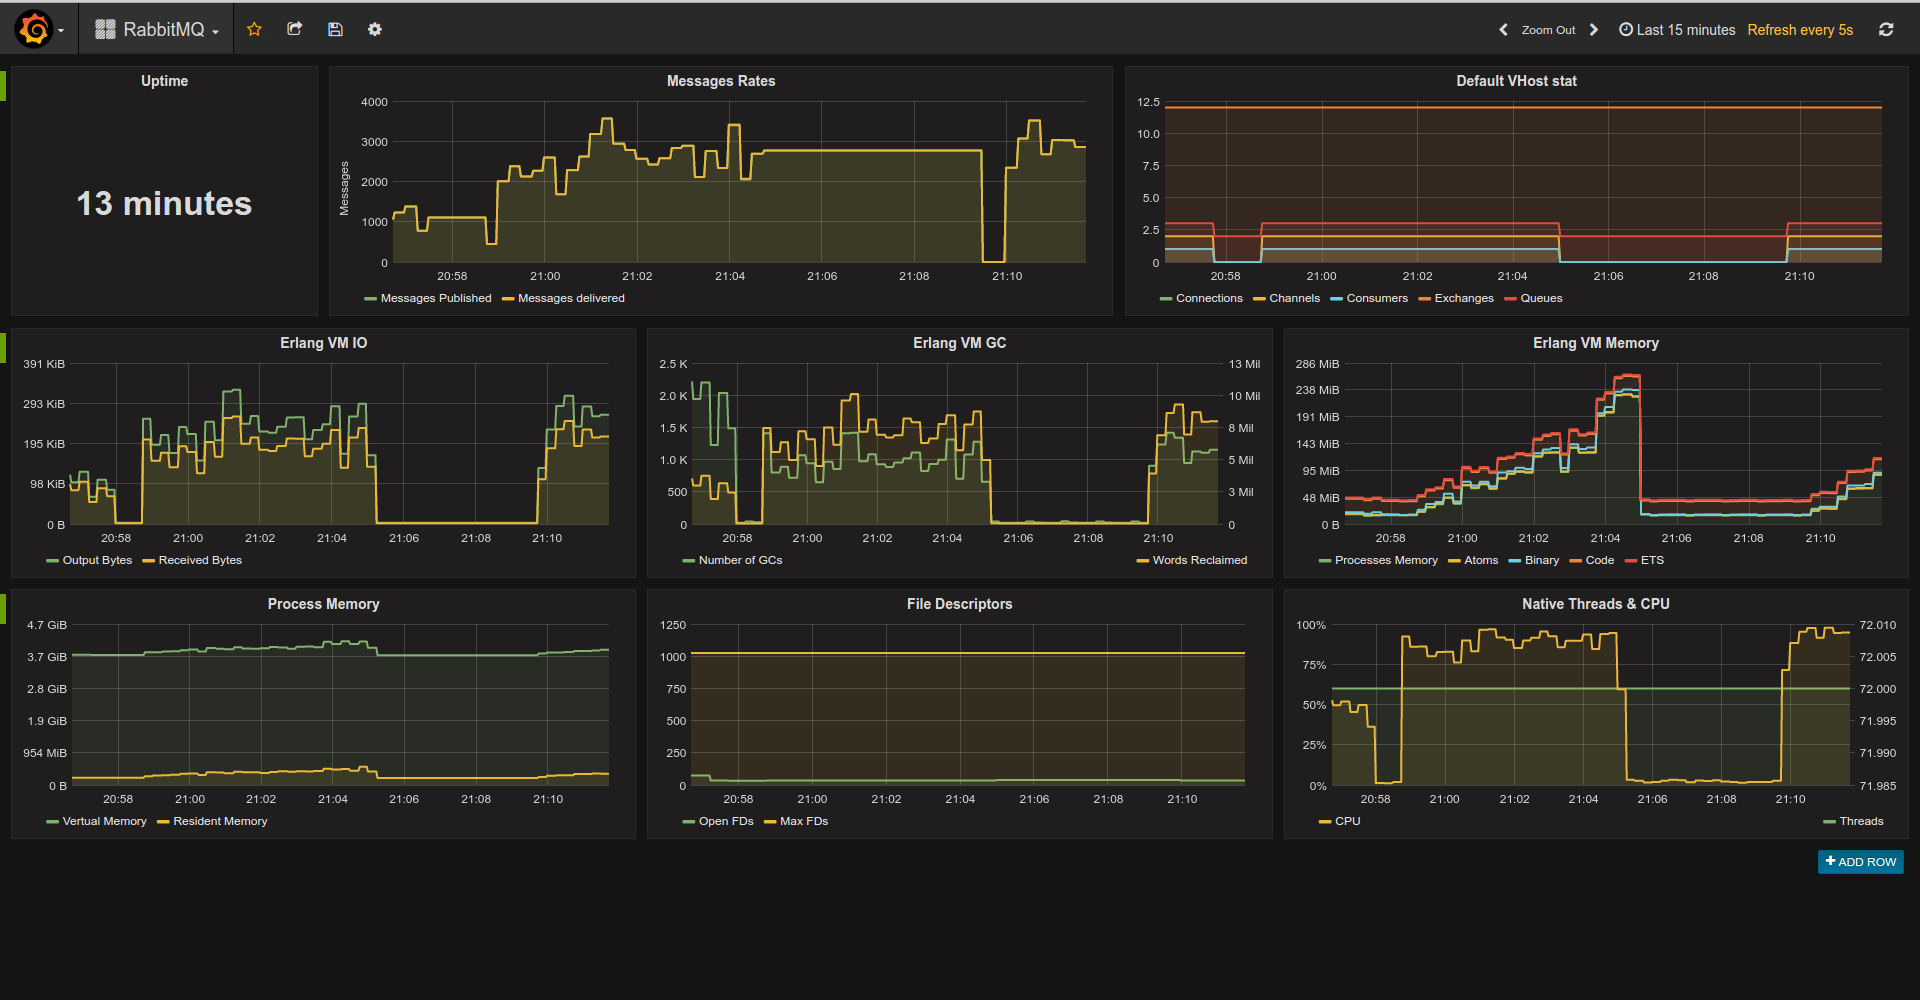
You can write custom collector/exporter for any library/app you'd like. For example here is [RabbitMQ Exporter](https://github.com/deadtrickster/prometheus_rabbitmq_exporter)
Elixir Plugs
-----
[Here](https://github.com/deadtrickster/prometheus-plugs) you can find Elixir Plugs.
Example Console Session
-----
Run shell with compiled and loaded app:
$ rebar3 shell
Start prometheus app:
``` erlang
prometheus:start().
```
Register metrics:
```erlang
prometheus_gauge:new([{name, pool_size}, {help, "MongoDB Connections pool size"}]),
prometheus_counter:new([{name, http_requests_total}, {help, "Http request count"}]).
prometheus_summary:new([{name, orders}, {help, "Track orders count/total sum"}]).
prometheus_histogram:new([{name, http_request_duration_milliseconds},
{labels, [method]},
{bounds, [100, 300, 500, 750, 1000]},
{help, "Http Request execution time"}]).
```
Use metrics:
```erlang
prometheus_gauge:set(pool_size, 365),
prometheus_counter:inc(http_requests_total).
prometheus_summary:observe(orders, 10).
prometheus_summary:observe(orders, 15).
prometheus_histogram:observe(http_request_duration_milliseconds, [get], 95).
prometheus_histogram:observe(http_request_duration_milliseconds, [get], 100).
prometheus_histogram:observe(http_request_duration_milliseconds, [get], 102).
prometheus_histogram:observe(http_request_duration_milliseconds, [get], 150).
prometheus_histogram:observe(http_request_duration_milliseconds, [get], 250).
prometheus_histogram:observe(http_request_duration_milliseconds, [get], 75).
prometheus_histogram:observe(http_request_duration_milliseconds, [get], 350).
prometheus_histogram:observe(http_request_duration_milliseconds, [get], 550).
prometheus_histogram:observe(http_request_duration_milliseconds, [get], 950).
prometheus_histogram:observe(http_request_duration_milliseconds, [post], 500),
prometheus_histogram:observe(http_request_duration_milliseconds, [post], 150).
prometheus_histogram:observe(http_request_duration_milliseconds, [post], 450).
prometheus_histogram:observe(http_request_duration_milliseconds, [post], 850).
prometheus_histogram:observe(http_request_duration_milliseconds, [post], 750).
prometheus_histogram:observe(http_request_duration_milliseconds, [post], 1650).
```
Export metrics as text:
```erlang
io:format(prometheus_text_format:format()).
```
->
```
# TYPE http_requests_total counter
# HELP http_requests_total Http request count
http_requests_total 2
# TYPE pool_size gauge
# HELP pool_size MongoDB Connections pool size
pool_size 365
# TYPE orders summary
# HELP orders Track orders count/total sum
orders_count 4
orders_sum 50
# TYPE http_request_duration_milliseconds histogram
# HELP http_request_duration_milliseconds Http Request execution time
http_request_duration_milliseconds_bucket{method="post",le="100"} 0
http_request_duration_milliseconds_bucket{method="post",le="300"} 1
http_request_duration_milliseconds_bucket{method="post",le="500"} 3
http_request_duration_milliseconds_bucket{method="post",le="750"} 4
http_request_duration_milliseconds_bucket{method="post",le="1000"} 5
http_request_duration_milliseconds_bucket{method="post",le="+Inf"} 6
http_request_duration_milliseconds_count{method="post"} 6
http_request_duration_milliseconds_sum{method="post"} 4350
http_request_duration_milliseconds_bucket{method="get",le="100"} 3
http_request_duration_milliseconds_bucket{method="get",le="300"} 6
http_request_duration_milliseconds_bucket{method="get",le="500"} 7
http_request_duration_milliseconds_bucket{method="get",le="750"} 8
http_request_duration_milliseconds_bucket{method="get",le="1000"} 9
http_request_duration_milliseconds_bucket{method="get",le="+Inf"} 9
http_request_duration_milliseconds_count{method="get"} 9
http_request_duration_milliseconds_sum{method="get"} 2622
```
Implementation Note
-----
Prometheus.erl exports two API sets.
- For Integers: `prometheus_coutner:inc`, `prometheus_summary:observe` and `prometheus_histogram:observe`. Implementation is based on `ets:update_counter`. While this is expected to be much faster than using processes for synchronization it restricts us to integers-only while Prometheus expects series values to be double.
ETS-based metrics are optimistic - for basic metrics such as counters/gauges it first tries to increment and iff series doesn't exist it queries ETS to check if metric actually registered and if so it inserts series. For histograms at least one lookup is required - we need buckets to compute bucket counter position.
- For Floats: `prometheus_coutner:dinc`, `prometheus_summary:dobserve` and `prometheus_histogram:dobserve`. Implementation is based on `gen_server` which is used for synchronizations (ets doesn't support float atomic increments).
***NOTE***: you can use float APIs after integer but not vice-versa.
Configuration
-----
Prometheus.erl supports standard Erlang app configuration.
- `default_collectors` - List of custom collectors modules to be registered automatically. If undefined list of all modules implementing `prometheus_collector` behaviour will be used.
- `default_metrics` - List of metrics to be registered during app startup. Metric format: `{Registry, Metric, Spec}` where `Registry` is registry name, `Metric` is metric type (prometheus_counter, prometheus_gauge ... etc), `Spec` is a list to be passed to `Metric:register/2`.
TODO
-----
- [x] Floats support
- [x] Tests
- [ ] Bucket generators
- [ ] Protobuf format
- [ ] Extend custom collectors collection?
Build
-----
$ rebar3 compile
License
-----
MIT
